
HurricaneMapping's KML File Description - Technical Note
Introduction
This manual describes the file format and types of map layers contained within HurricaneMapping.com’s KML storm advisory files. These files are designed for storm tracking and visualization purposes within Google Earth software. The map layers are derived from National Hurricane Center, Central Pacific Hurricane Center, and Joint Typhoon Warning Center forecast advisories issued for tropical depressions, tropical storms, and hurricanes or typhoons.
HurricaneMapping servers ingest these official government forecasts, then model and convert the data to map layers. KML storm advisory files can be downloaded from http://www.hurricanemapping.com/data using a web browser.
Advisories from live storms may also be automatically retrieved from HurricaneMapping’s servers through a network link within Google Earth. These features require a HurricaneMapping.com subscription with userid and password login.
File Formats
What are KML and KMZ Files?
Keyhole Markup Language, or KML, is an XML-based language for geospatial data. KML describes not only the geospatial elements, but also styling rules for the elements’ graphic display. Keyhole, Inc. first developed the language and software application that is now known as Google Earth. Due to the popularity of the KML format and Google Earth, a number of other mapping programs are beginning to adopt the format as well.
KML data is often distributed in the form of a KMZ, consisting of a zipped doc.kml file and associated other files. A KMZ is smaller in size and more portable than straight KML, making it the ideal format for distributed data. No unzipping step is necessary--Google Earth will load KMZ files directly into the program just as it does with KML.
HurricaneMapping KML Files
HurricaneMapping’s storm advisories are packaged as KMZ files. They contain a doc.kml file plus a folder of custom icons. HurricaneMapping files use KML 2.1 and thus require Google Earth version 4.0.2 or higher for correct display. You may find some use for HurricaneMapping files in other programs that read KML, however the format for these storm advisories has been optimized for use in Google Earth.
Data Distribution
Advisory Issuance Times
The Hurricane Centers have the following standard times for forecast advisory issuance:
- 09 UTC (5 AM EDT) Where UTC is also known as GMT or Zulu
- 15 UTC (11 AM EDT)
- 21 UTC (5 PM EDT)
- 03 UTC (11 PM EDT)
In actual practice, issuance of the Hurricane Center advisory often is up to 30 minutes earlier. A HurricaneMapping KML file is ready for retrieval less than 5 minutes later. Intermediate advisories having a letter extension of A or B are issued at 2 or 3-hour intervals when storms are nearing landfall. HurricaneMapping’s servers also publish these intermediate advisories as well.
HurricaneMapping’s KML datafeed is subscription-based. Subscribers (with user-id and password) have several options for retrieving KML storm data from HurricaneMapping’s web server.
Live Storms
HurricaneMapping furnishes subscribers with an ‘Active Tropical Storms’ network link for live storm tracking. As long as Google Earth is running and your "Active Tropical Storms" network link is checked on, you will receive hourly updates of new storms and advisories.
Archived Storms and Advisories
Individual advisories from both current and historical storms may be downloaded using a web browser, via login to http://www.hurricanemapping.com/data. A KMZ file is named according to the storm name, advisory number, and year in which it occurred (i.e. Katrina22A_2005.kmz for an intermediate advisory and Isabel10_2003.kmz for a main advisory)
Map Layers
HurricaneMapping’s KML files will contain various map layers depending on the conditions of the storm. Here we have loaded into Google Earth, the file Katrina22_2005.kmz.
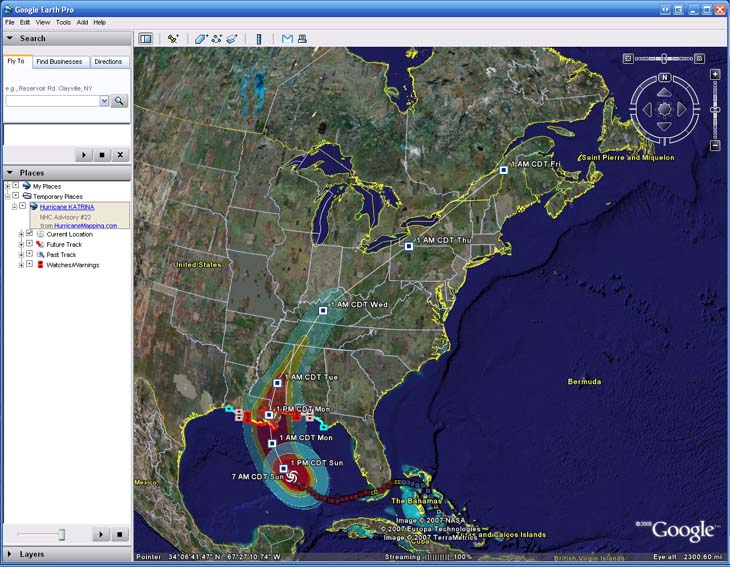
Four folders appear on the left under the heading “Hurricane KATRINA, NHC Advisory #22, from HurricaneMapping.com”
- Current Location
- Future Track
- Past Track
- Watches/Warnings (this folder will not be present for storm advisories with no watches or warnings issued)
Expanding these folders, we see the following list of map layers appear:
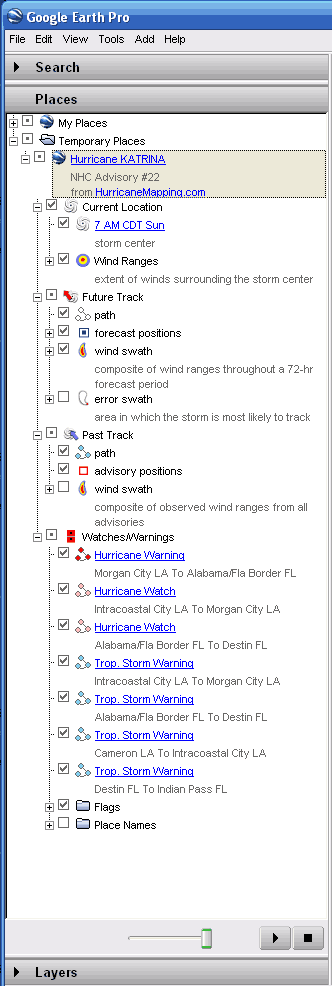
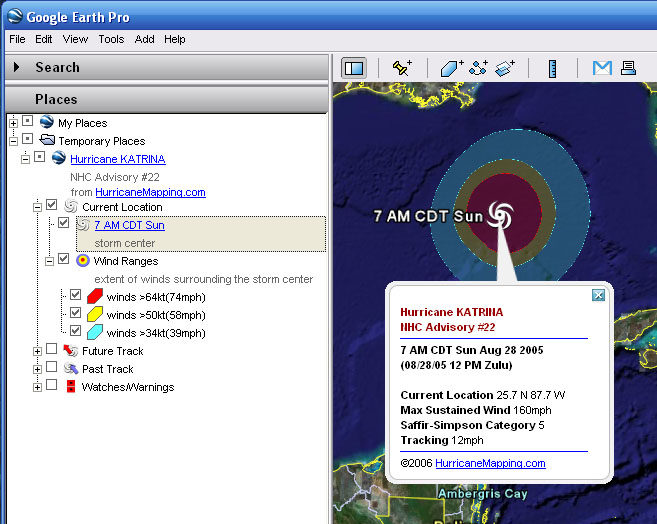
Current Location
The Current Location folder consists two items: location of the storm center at the time of advisory issuance and the extent of winds surrounding the storm center.
The rings represent the extent of tropical storm force winds (34kt or 39mph) in blue, 50kt or 58mph winds in yellow, and hurricane force (64kt or 74mph) winds in red.
Click on the hurricane icon on the map or on the legend, and an information balloon will appear on the map as shown below.
Future Track
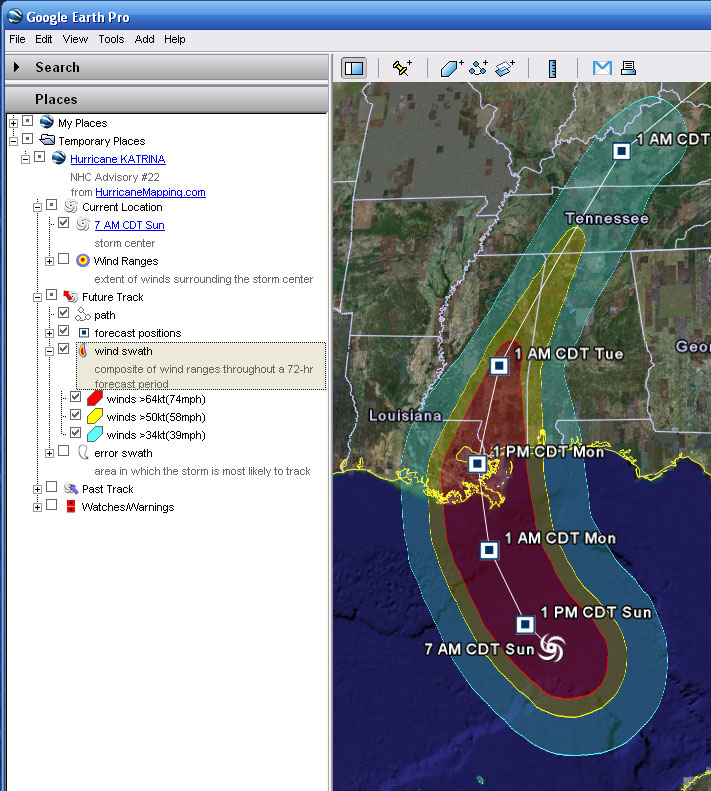
The Future Track folder consists of 4 items: path, forecast positions, wind swath, and error swath.
Path is a solid white line ahead of the storm, representing where the storm center is projected to track within the next 3 to 5 days (72 to 120 hours).
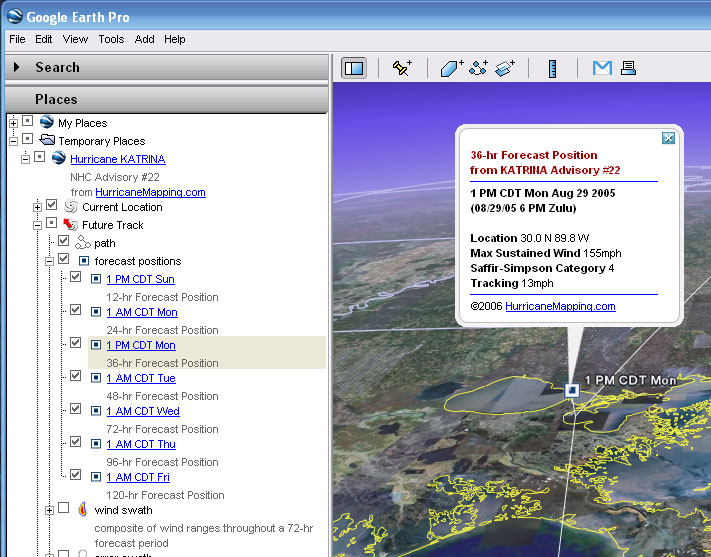
Forecast Positions are the blue and white squares along the forecasted path. The Hurricane Center issues storm location and intensity projections for up to seven time periods--12, 24, 36, 48, 72, 96, and 120 hours into the future. They are labeled with the date and time.
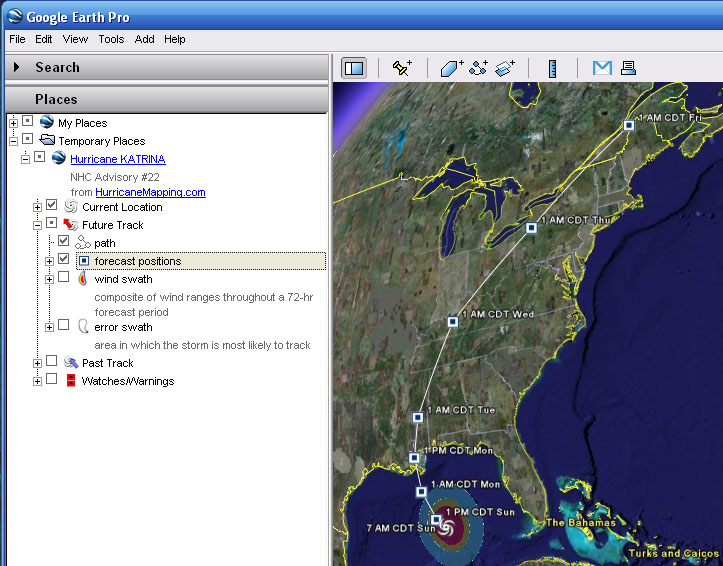
Shown below, we have expanded forecast positions item in the legend and double-clicked on the 36-hour forecast position. Google Earth flies into a closer view of that location and displays an information bubble containing storm statistics projected at that time.
Wind Swath represents a composite of wind ranges throughout a 72-hour forecast period.
The fill colors represent the extent of tropical storm force winds (34kt or 39mph) in blue, 50kt or 58mph winds in yellow, and hurricane force (64kt or 74mph) winds in red.
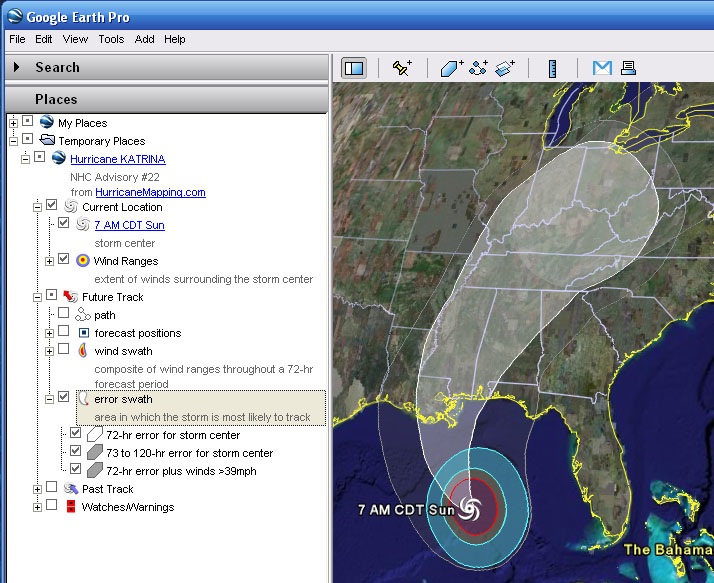
Error Swath is the large white swath in the middle represents the area in which the storm center is most likely track within the next 72 hours(3 days). The swath gets wider at a rate equal to the average error rate per hour of forecast, and thus is quite wide in the latter hours. This reflects the uncertainty in the hurricane forecast process. The swath means that even though the Hurricane Center has forecast a specific track, the storm could end up anywhere within the swath within the next 72 hours, with around a 60% confidence level.
Tropical storm force winds (72-hr error plus winds>39mph) might occur in the larger, lighter gray region if the storm tracked at the outer edge of the error swath.
The transparent area bordered by a gray ellipse represents the Average Error Swath for 73 to 120 hours (5 days). (This is cut off in the illustration below)
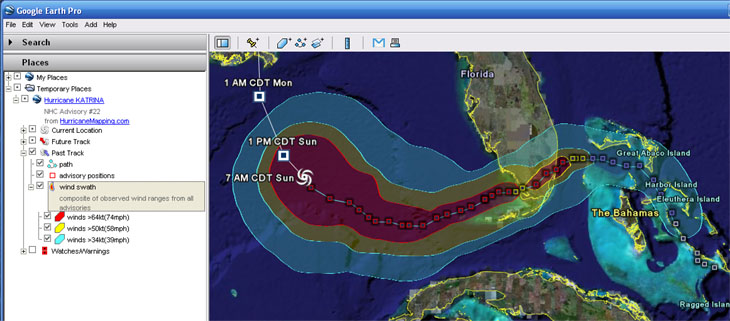
Past Track
The Past Track folder consists of three items: path, advisory positions, and wind swath.
Path is the solid blue line behind the storm, representing the actual path the storm has taken.
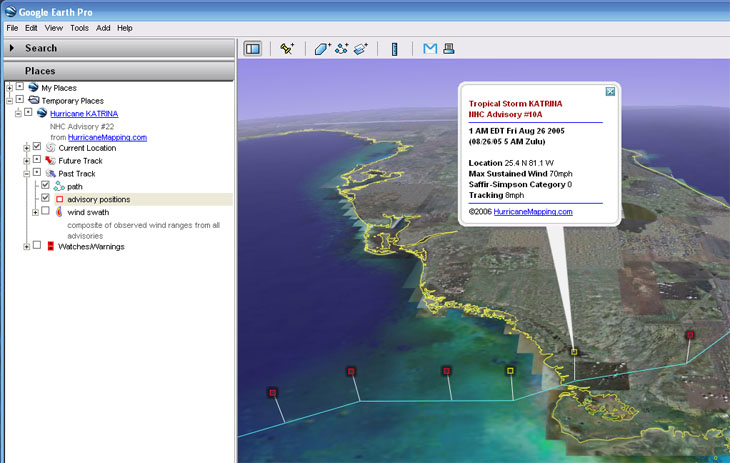
Advisory positions, squares along the past track path, are the observed locations of the storm center at the time of previous advisory issuances. They are colored according to the maximum intensity of winds at those times—blue if a tropical storm (>34kt or 39mph winds), yellow if winds over 50kt or 58mph, and red if a hurricane (>64kt or 74mph winds).
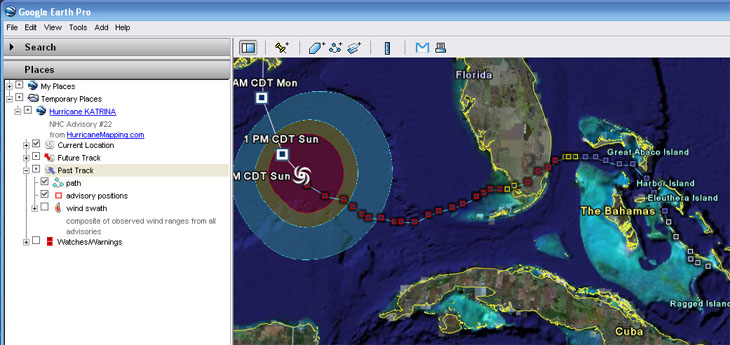
Shown below, we have double-clicked on an old advisory position—Intermediate Advisory 10A over the tip of Florida. Google Earth flies into a closer view of that location and displays an information bubble containing storm statistics from that time.
Wind swath represents a composite of observed wind ranges from past advisories.
The fill colors represent the extent of tropical storm force winds (34kt or 39mph) in blue, 50kt or 58mph winds in yellow, and hurricane force (64kt or 74mph) winds in red.
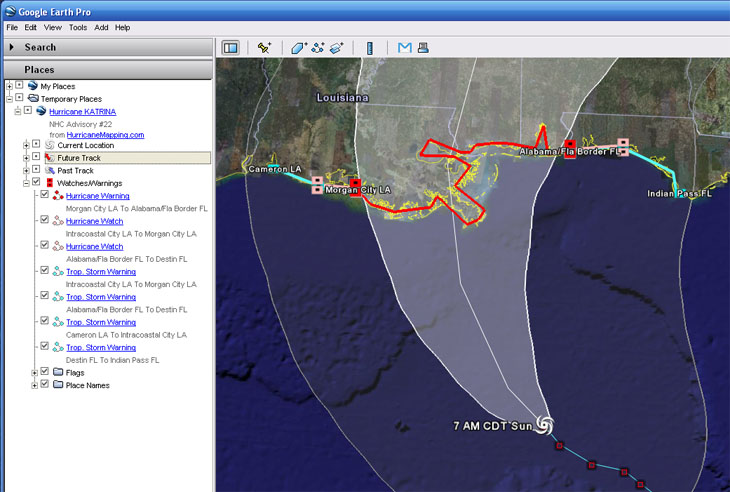
Watches/Warnings
Watches and warnings appear as lines along the coast and as flags marking the starting and ending location for each item.
Hurricane warnings (red) are issued when hurricane conditions are expected within 24 hours and hurricane watches (pink) are issued when hurricane conditions are possible within 36 hours. Tropical storm warnings (blue) are issued where those conditions are expected within 24 hours and tropical storm watches (green) are issued when that threat is possible within 36 hours.
Technical Support
Help for this and all other HurricaneMapping products and services is available 24/7 at support@hurricanemapping.com or (888) 840-4089.
Legal Notices
©2007 Sea Island Software, Incorporated. All rights reserved.
HurricaneMapping KML File Description, Ver. 1.0
This document is furnished under subscription and may be used or copied only in accordance with the terms of the HurricaneMapping subscription agreement. The contents of this document are subject to change without notice and do not represent a commitment on the part of the Sea Island Software, Inc.
Google Earth ™ is a trademark of Google.
Products named herein may be trademarks of their respective manufacturers and are hereby recognized. Trademarked names are used editorially, to the benefit of the trademark owner, with no intent to infringe on the trademark.