
HurricaneMapping News - December 2007
Season’s Greetings from Sea Island Software! We’re sending out this newsletter to recap developments from the first year of HurricaneMapping.com—our storm tracking service for Google Earth and ESRI’s ArcGIS-- and to let you know about subscription plans for 2008.
Thank you for your participation and feedback during HurricaneMapping’s free beta season. We’ve heard from a number of you in emergency management and business continuity that HurricaneMapping’s Shapefile and KML datafeeds are filling a need for comprehensive, real-time storm tracking information that can be easily integrated with your own asset mapping systems. Our goal for the future is to enhance and expand the services that HurricaneMapping provides, while maintaining its ease of use and affordability. Please read on for details…
- 2007 Tropical Activity Review
- Probabilistic Forecast Products Being Added to HurricaneMapping’s Datafeed
- 2008 HurricaneMapping Subscription Plans
_________________________________________________________
 2007 Tropical Weather Review
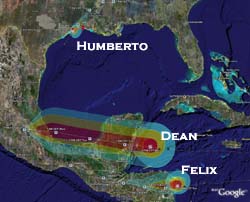
This turned out to be a relatively quiet hurricane season for those with interests along the Eastern and Gulf Coasts of the United States. The Atlantic Basin saw a total of 14 named storms and 6 hurricanes in 2007, though Humberto, in September, was the only storm of hurricane strength to make landfall in the US. The two most intense storms of the Atlantic season—Cat 5 Hurricanes Dean and Felix—instead struck devastating blows to Central America and Mexico.
The East Pacific Basin’s most significant storm of 2007 was Hurricane Henriette which crossed the southern tip of the Baja Peninsula as a Cat1 and then entered the mainland Gulf of California coast as a strong tropical storm. In August, Hurricane Flossie bypassed the Big Island of Hawaii just 100 miles to the south.
Typhoon activity in the West Pacific remained steady throughout the year, with 22 named storms through the end of November. Super Typhoon Wipha prompted massive evacuations in China in September when initially projected to strike Shanghai. And HurricaneMapping’s newly-added Indian Ocean coverage recently tracked the most significant storm of 2007—Tropical Cyclone Sidr which devastated the low-lying nation of Bangladesh in mid-November.
Screenshots and selected KML and Shapefile advisory datasets from these significant storms of 2007 can be downloaded from the HurricaneMapping web site at http://www.hurricanemapping.com/2007season. We’ve located this collection outside of the subscriber-only portion of the web site, so feel free to share this link with non-subscribers who might also be interested in the data.
_________________________________________________________
 Probabilistic Forecast Products Being Added to HurricaneMapping’s Datafeed
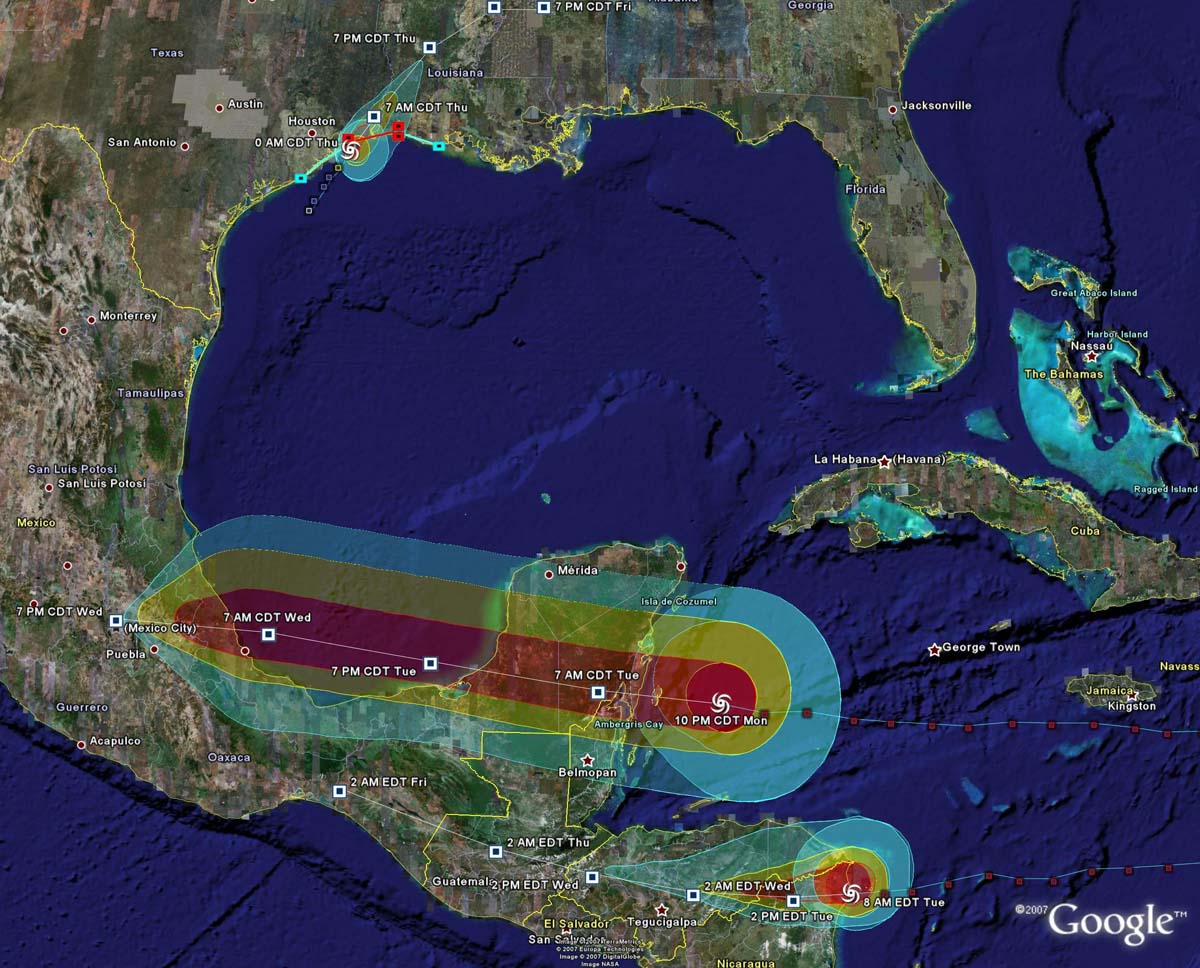
When tracking a storm with HurricaneMapping, you’ve probably become accustomed to looking at the 120-hour projected track for the storm center and the 72-hour wind swath for the extents of winds along the projected track. These two items are examples of map layers derived from deterministic forecast products issued by the National Hurricane Center—they present ‘best guesses’ of what future conditions might be. Deterministic products are most useful when a storm is close and threatening because that is when the forecast accuracy is greatest.
In recent years, the NHC has begun quantifying and communicating forecast uncertainties by issuing products to compliment its deterministic forecasts. For example, the average error swath that you find in HurricaneMapping represents the area in which a storm center is most likely to track given the NHC’s past performance in projecting storm movement. Decision makers are encouraged to not to focus on the specific forecast track, but rather on the area in which the storm could potentially track.
Now the NHC is further quantifying and detailing forecast uncertainties through a collection of new probability products for winds and storm surge. As of this writing, TPC/NHC's Tropical Cyclone Wind Speed Probabilities products are operational, while the Probabilistic Storm Surge products are in experimental phase. We have recently added wind probabilities to HurricaneMapping's datafeed and will do the same with surge probabilities once they become operational. You'll find that all of HurricaneMapping's new advisory datasets (beginning last month with Hurricane Noel) contain polygon shapefiles for probabilities of 34kt, 50kt, and 64kt winds in 20 cumulative time frames extending from 0-6 hours to 0-120 hours.
In the past, decisions whether or not to act upon uncertain wind threats have been subjective and somewhat arbitrary because they had to be made based solely upon deterministic wind extent forecasts and rough consideration of the average error swath. We believe that these new probability products can provide critical guidance for decision-makers facing potential hurricane hazards, with policies and procedures developed that define an organization's specific risk tolerance thresholds (i.e. We will close any facilities located where the probability of hurricane-force wind is greater than 20%) and timing considerations (i.e. We don't need to close this facility until the threat of hurricane-force winds is within 18 hours).
Please visit our web site for more information on HurricaneMapping's implementation of the wind probabilities products.
_________________________________________________________
2008 HurricaneMapping Subscription Plans
Sea Island Software has extended all beta season subscriptions through January 31, 2008 in order to ensure the continuity of your service into the New Year. We hope you’ve have found HurricaneMapping useful and will plan to renew your subscription in January. You’ll receive another e-mail from us at that time with simple instructions for how to do this online, but in the meantime here are the 2008 pricing plans for single user licenses for your consideration:
- KML subscription only - $150/year
- Shapefile subscription only - $350/year
- Combined KML and Shapefile subscriptions - $450/year
If your agency or corporation has two or more individuals needing HurricaneMapping subscriptions, then you will be able to purchase your licenses in bulk at a 20% discount. Detailed instructions will be included in the January e-mail, but feel free to contact us if you have any questions beforehand.
We also offer special pricing scenarios for enterprise-wide applications of HurricaneMapping services. If you wish incorporate and distribute HurricaneMapping data within your own ArcIMS, ArcGIS Server, Google Enterprise Server, or other type of application, please contact us for more information. Sea Island Software can arrange for push or pull feeds of specified HurricaneMapping’s data to your enterprise application.
And one final comment on the topic of support and service…Sea Island Software has a long-standing reputation for personal service and system reliability with HURREVAC, our flagship hurricane tracking program for government emergency managers. You can expect the same gold standard for HurricaneMapping, with maintenance and technical support included in our subscription services at no additional charge. We monitor our datafeeds 24/7 and stand ready to respond to our HurricaneMapping subscribers’ support needs at any time.
_________________________________________________________
Best wishes for the holiday season and we look forward to working with you in 2008!
Sea Island Software, Inc.
410 Live Oak Drive
Mount Pleasant, SC 29464
(888)840-4089
support@hurricanemapping.com